A Claude Code skill called Graphify just hit 450,000 downloads and 40,000 GitHub stars in 26 days. The Graphify knowledge graph approach is what made that possible: it claims 71x fewer tokens per query compared to naive context retrieval.
That number alone would be worth noting. But the claim attached to it is what I want to dig into properly. Because I keep seeing it quoted without anyone explaining what it actually means for day-to-day development work.
If it holds at enterprise scale, even at 20x in practice, it changes the fundamental economics of agentic coding workflows. And that is a problem that has been quietly killing enterprise AI coding programs for the past 18 months.
The Problem Nobody Talks About#
When an AI coding tool helps you write or review code, it needs context. It needs to know what files are relevant, what functions exist, how the codebase is structured.
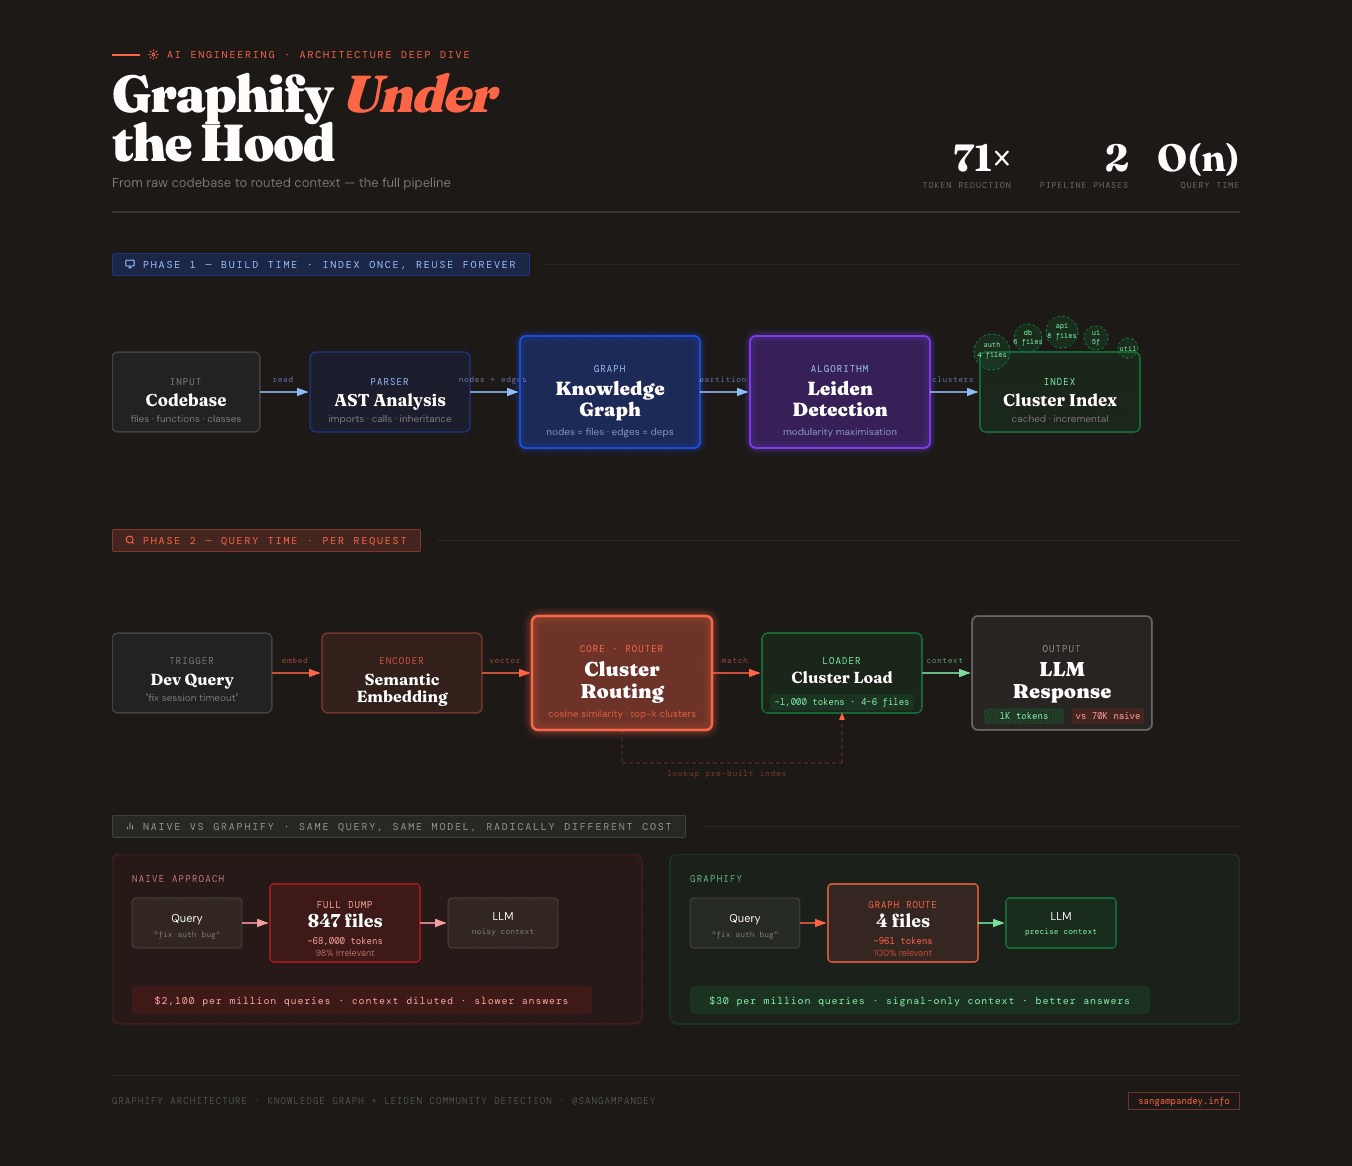
Most tools solve this the naive way: load everything and hope the relevant parts are somewhere in the 70,000 tokens you just spent.
At small scale this is fine. At enterprise scale, millions of queries per month, continuous code review agents, always-on architecture analysis, the math becomes brutal.
| Approach | Tokens per query | Cost per 1M queries |
|---|---|---|
| Naive dump | ~70,000 | ~$2,100 |
| Graph retrieval (Graphify) | ~1,000 | ~$30 |
A team running 50M queries per month is looking at the difference between $105,000 and $1,500. Every month.
This is the cost problem that the Uber engineering story surfaced a while back. It is why enterprise AI coding pilots that started strong are getting quietly defunded. The intelligence is not the bottleneck. The context cost is.
What Actually Happens When You Use Graphify#
The documentation explains the architecture well enough. What is less clear is what the workflow actually looks like from the moment you install it.
Step 1: Install the skill. You add Graphify as a Claude Code skill. This takes about 60 seconds and requires nothing beyond a Node.js environment.
Step 2: Index your codebase. The first time you use it, Graphify runs a static analysis pass over your repository. It parses every file, extracts functions, classes, imports, and exports, and builds a graph where each of those is a node. Every import statement, every function call, every type reference becomes a directed edge. For a 1,000-file codebase this takes somewhere between 30 seconds and a few minutes depending on language and file size.
Step 3: Community detection runs. Once the graph is built, the Leiden algorithm partitions it into clusters. You do not configure this manually. The algorithm figures out that your authentication code, your session handling, your JWT utilities, and your middleware are all tightly connected to each other and loosely connected to everything else. It puts them in a cluster. Same thing happens with your database layer, your API handlers, your UI components. The clusters roughly match how a senior engineer would mentally partition the codebase.
Step 4: The index is cached. Graphify stores the graph and cluster assignments locally. It does not rebuild the full graph on every query. When files change, it updates incrementally, recomputing only the affected subgraphs.
Step 5: You ask a question normally. From here, your workflow does not change. You type a question into Claude Code the same way you always did. The difference is what happens underneath. Before your query reaches the model, Graphify intercepts it, maps the query terms to relevant graph nodes, identifies which cluster or clusters those nodes belong to, and assembles a context window from only those files.
Step 6: The model receives a focused context. Instead of 847 files, the model gets 4. Instead of 70,000 tokens, it gets around 1,000. And because those 4 files are the ones that actually contain the code relevant to your question, the answer quality does not degrade. Often it improves, because the model is not swimming through irrelevant boilerplate to find the signal.
That is the full loop. The first time through it feels like nothing changed. Then you notice the responses are faster. Then you notice the bill.
A Concrete Before and After#
Here is a scenario that I think illustrates this better than any benchmark number.
You are working on a mid-sized Rails application. About 600 files. You have a bug in your authentication flow. Users are being logged out unexpectedly after about 20 minutes, which is shorter than your session timeout. You ask Claude Code: "Why would a user session expire before the configured timeout?"
Without Graphify: Claude Code loads context using its default approach. It reads your project structure, grabs files it thinks might be relevant based on keyword matching and file proximity, and assembles a context window. On a 600-file codebase, this typically pulls in 60 to 80 files, somewhere in the range of 40,000 to 60,000 tokens. A lot of those files are tangentially related at best. Your API controllers get included. Your mailer templates get included. Your i18n files get included. The model has to read all of that before it can reason about your session bug.
With Graphify: Your session-related code forms a tight cluster. SessionsController, SessionStore, Authenticatable concern, JwtService, a couple of middleware files, your session configuration initializer. When you ask about session expiration, Graphify routes your query to that cluster. The model receives 4 to 6 files, around 800 to 1,200 tokens. It reads them, spots that your SessionStore implementation has a hardcoded 20-minute TTL that overrides the application-level timeout configuration, and tells you exactly which line to fix.
The quality of that second answer is higher, not just cheaper to produce. The model is less likely to hallucinate something plausible-sounding about a file it barely skimmed. It is reasoning about the exact code that matters.
Multiply that interaction by the number of times a day your team talks to an AI coding tool and you start to see where the 71x claim comes from.
Why Leiden Specifically, Not Louvain#
This is the technical question worth spending a few sentences on, because Louvain is far more commonly used and the difference is not obvious from the outside.
Both algorithms optimise for modularity, which is a measure of how densely connected nodes are within communities compared to what you would expect if edges were distributed randomly. Higher modularity means tighter clusters with cleaner boundaries.
The problem with Louvain is that it can produce disconnected communities. In the intermediate steps of the algorithm, a community can end up containing nodes that are not actually reachable from each other within that community. Nodes that should belong together get orphaned in a cluster where they have no meaningful neighbors. For social networks this is an irritant. For code graphs it is a correctness problem.
Consider a shared utility module. Your StringUtils or DateHelpers class has edges going to dozens of different clusters because everyone imports it. Louvain sometimes resolves this ambiguity by splitting the utility across communities in a way that creates disconnected fragments. When Graphify goes to retrieve context for a query touching that utility, it may get an incomplete picture.
Leiden adds a refinement step that Louvain lacks. After the initial community assignments, it revisits each community and checks whether it is internally connected. Communities that are not connected get split. Then it re-optimises. This adds computation time but produces communities that are provably connected, which means every node in a cluster is actually reachable from every other node via internal edges.
For code graphs specifically, where shared utilities create exactly the high-fan-in patterns that stress Louvain, Leiden's guarantee matters. It is not a dramatic difference on small or cleanly structured codebases. On large enterprise codebases with sprawling shared infrastructure, it is the difference between clusters that map to real architectural boundaries and clusters that are artifacts of the algorithm's intermediate state.
The Leiden paper (Traag et al., 2019) is readable if you want the formal proof. The practical takeaway is: Leiden is slower than Louvain but produces higher quality partitions on graphs with dense cross-community connectors. Code dependency graphs have exactly that topology.
What the 71x Actually Changes in Your Workflow#
The number matters less than what it unlocks.
At 71x token reduction, a few things become possible that were not practical before.
Continuous review agents become affordable. You can run a code review agent on every pull request without thinking about cost. At 70,000 tokens per query and current pricing, running a review agent on every PR for an active team is a real budget line. At 1,000 tokens per query it is noise.
You can query more aggressively. Right now, a lot of developers self-censor their AI queries. They ask fewer questions, bundle questions together, avoid asking about "obvious" things because they feel like they are wasting tokens. With graph retrieval, that friction goes away. You ask things you would have figured out yourself because it was not worth the cost to ask. That behavioral change compounds over time.
Always-on architecture analysis becomes feasible. The use case I find most interesting is not interactive queries at all. It is background agents that continuously monitor your codebase and flag drift: circular dependencies forming, modules growing past a certain size, coupling between clusters increasing. These agents need to run constantly and query frequently. Graph retrieval makes the economics work.
Context quality improves at the same time cost drops. This is the part that surprised me when I thought it through. The naive assumption is that you are trading quality for cost. You are loading fewer files so the model has less information. But the files you are loading are the right ones. A model reasoning about 4 tightly relevant files will often outperform the same model reasoning about 80 files where 76 of them are distractions. The 71x is not just a cost win. It is a precision win too.
What does not change: the fundamental interaction model. You still type questions. You still get answers. You do not configure the clustering. You do not tell Graphify which files are related. It figures that out. The workflow change is invisible. The economics are not.
When It Breaks Down#
This is the section most blog posts skip. Here is what I think are the honest failure modes.
Monorepos with extremely shared infrastructure. If you have a monorepo where 40% of files import from a single core package, the Leiden clustering will struggle to cleanly separate communities. The core package has so many cross-cutting edges that it either becomes its own massive cluster (which gets loaded for every query) or gets fragments distributed across multiple clusters (which means incomplete context on any given query). The algorithm has resolution parameters you can tune to push toward finer or coarser clustering, but on truly shared infrastructure this requires experimentation.
Dynamic languages with heavy metaprogramming. Graphify's graph is built from static analysis. Python and JavaScript have decent AST tooling, so basic imports and function calls are captured well. But if your codebase relies heavily on dynamic dispatch, runtime-constructed method calls, or metaprogramming patterns, the static graph will be sparse in exactly the places where the runtime dependency graph is dense. A Rails codebase with extensive use of method_missing, or a Python codebase using heavy metaclass magic, will produce clusters that do not match the actual execution-time relationships. The retrieved context may miss critical files.
Stale indexes on fast-moving codebases. Graphify updates its index incrementally, but there is still a lag. On a codebase where multiple engineers are landing large refactors several times a day, the index can be a few commits behind. This is usually fine for stable parts of the codebase. For actively changing modules it means the clustering may reflect yesterday's architecture, not today's. The fix is to trigger a full reindex periodically, which adds a few minutes of overhead. Not a dealbreaker, but worth knowing.
Very small codebases. Below a few hundred files, the overhead of building and maintaining the graph outweighs the retrieval benefit. On a small project, naive loading of the whole codebase is already cheap enough that the 71x improvement over that baseline is not meaningful in dollar terms. Graphify is solving an enterprise-scale problem. On a solo project with 50 files, you probably do not need it.
Codebases with no clear architectural boundaries. Leiden finds communities that actually exist in the graph. If your codebase has high coupling everywhere and no clear module boundaries, the algorithm will still produce clusters, but they will be arbitrary partitions rather than meaningful semantic units. This is more of a codebase health problem than a Graphify problem. If everything depends on everything, no retrieval strategy will save you.
The Leiden Algorithm, Briefly#
For those who want the mechanism: Leiden is a graph partitioning algorithm that maximises modularity, a measure of how densely connected nodes are within communities compared to what you would expect in a random graph with the same degree distribution.
In practice:
- Every node starts in its own community.
- The algorithm moves nodes between communities to increase modularity. This phase is identical to Louvain.
- The refinement phase runs. Each community is checked for internal connectivity. Disconnected communities are split. The algorithm then looks for merges that improve the overall score.
- The graph is coarsened by collapsing each community into a single super-node and the process repeats on the coarser graph.
- This continues until no single move improves the overall modularity score.
For a codebase with 1,000 files and 10,000 dependency edges, this converges in a few seconds. The clusters it produces are stable across runs, which matters for caching. The same codebase will produce the same clusters every time you reindex, assuming the underlying code has not changed.
Why 450K Downloads in 26 Days Is a Signal#
Speed of adoption tells you whether a tool solved a real, widely-felt problem or a niche one.
450,000 downloads in 26 days with 40,000 GitHub stars means the pain was real and the solution was immediately obvious to practitioners. Most developer tools take 6 to 12 months to hit 100,000 downloads.
More telling: the builder mentioned that the quality of community contributions improving the algorithm was unexpected. Production engineers with real enterprise codebases showed up, stress-tested it, and sent patches. Not just stars and forks. Actual expert engagement with the core algorithm.
That is a different kind of adoption signal. It means the people who hit the failure modes I described above found the tool valuable enough to fix it rather than abandon it.
The Bigger Shift#
Graphify is one tool. But it points at something happening in AI coding infrastructure more broadly.
The pattern: model your codebase as a graph, detect logical clusters, route queries to the right cluster, return minimal high-signal context to the model. This is graph-based RAG applied to code. The same shift that happened in search, from keyword matching to semantic understanding of document structure, is happening in code context retrieval now.
The companies and engineers that standardise on this architecture first will build the tools everyone else runs on. The interesting question is not whether graph-based retrieval wins. It is what the second-order effects look like once every AI coding tool has it. When context is cheap and precise, what do you build with that headroom?
LinkedIn Carousel#
I put together a 9-slide visual breakdown of this for LinkedIn. View it below or open the full interactive carousel.
View the full LinkedIn carousel →
The Honest Caveats#
The 71x number is the builder's claim. I have not independently benchmarked it on a real enterprise codebase. Real-world improvement will depend heavily on codebase architecture, query distribution, and cluster granularity. A codebase with clean module boundaries will see better gains than one with high cross-cutting coupling.
Leiden community detection has the failure modes I described above: monorepos with extremely high fan-in on shared utilities, dynamic languages with heavy metaprogramming, codebases with no clear architectural separation. These are real. Worth testing on your specific codebase before betting production on it.
The economics calculation assumes a fixed token price. As prices continue to fall, the absolute dollar savings shrink. But the relative advantage of graph retrieval over naive loading stays constant, and the precision improvement does not depend on pricing at all.
Even with those caveats: if your team is running AI coding tools at scale and you have not looked at graph-based context retrieval, the Graphify numbers are worth taking seriously.
The repo is at github.com/safishamsi/graphify.
FAQ#
Is this only for Claude Code? Graphify is currently a Claude Code skill, but the underlying graph retrieval approach is model-agnostic. The architecture could be ported to other AI coding tools. The Leiden algorithm does not care which model consumes the retrieved context.
How long does the initial index take? Expect 30 seconds to a few minutes on first run, depending on codebase size and language. After that, incremental updates on file changes are fast. The full reindex penalty is a one-time cost per fresh checkout.
How does it handle monorepos with shared utility modules? Shared utilities tend to be highly connected across clusters, which means Leiden may not cleanly separate them. The algorithm has resolution parameters you can tune to push toward finer clustering. On very large monorepos with deeply shared infrastructure this requires experimentation. It is the most common real-world failure mode I have seen reported.
What is the latency overhead of building and querying the graph? Initial graph construction is the main cost, measured in seconds to minutes. Query routing adds minimal latency on top of the retrieval itself, typically under 100ms. The graph is cached in memory between queries.
Does it work with dynamic languages where dependencies are harder to statically analyse? Static analysis quality varies by language and codebase style. Python and JavaScript have reasonable AST tooling and Graphify handles straightforward import patterns well. Codebases that rely heavily on dynamic dispatch, runtime-constructed attribute access, or heavy metaprogramming will produce sparser graphs with less accurate clustering. The retrievals still work, they just may miss files that are only related at runtime.
Does it work with tests and documentation files? By default, Graphify indexes source files. Test files can be included or excluded via configuration. Including them tends to improve retrieval for queries about testing patterns but adds noise for queries about production logic. Documentation files are generally excluded since they have no import relationships to form meaningful graph edges.
What happens when the index is out of date? Graphify updates incrementally as files change. On fast-moving branches with large refactors, there can be a lag of a few commits. The practical effect is that the clustering reflects slightly older architecture. For most queries this does not matter. For queries about code that was just restructured, you may want to trigger a manual reindex before asking.