The first thing I noticed when I ported an Agno agent to LangGraph was the absence of a single parameter. In Agno you can write cache_system_prompt=True and the framework handles the rest. In LangGraph there is no such thing. There is no built-in system prompt parameter at all. The system prompt is whatever you put in front of your message list inside a node function.
That means every decision about prefix stability is yours. The order of messages, whether the system prompt object gets recreated on every call, whether tools are bound once or on every invocation. None of it is handled for you. The framework does not care.
Which also means that when the cache stops working, it is usually your fault. That is actually useful information. There is no magic to debug. There is just the prefix, and whether it is identical between requests.
This is post 4 of 4 in my series on prompt caching. If you have not read the earlier posts, the physics of prompt caching and the static-first architecture principles will give you the conceptual foundation. The Agno implementation post covers the same patterns in a framework that does more of the work for you. This post is for LangGraph specifically, where you are doing it yourself.
Table of Contents#
- Rule 1: Static-first prompt ordering in LangGraph
- Rule 2: Never mutate tools mid-session
- Rule 3: Dynamic context via messages, not the system prompt
- Rule 4: Cache-safe compaction in LangGraph
- The six anti-patterns
- Monitoring and alerting in production
- FAQ
Live demo: the Prompt Caching Demo runs the LangGraph implementation from this post. Switch to the LangGraph tab in the code panel to follow along. Ask a question, then a follow-up, and watch the hit rate climb as the conversation grows.
Rule 1: Static-First Prompt Ordering in LangGraph#
The key insight is that the SystemMessage object needs to be defined once, at module level, and never touched again. If you define it inside the node function, Python creates a new object on every invocation. The content might be identical, but you are adding unnecessary surface area for a bug where something slips into the content string.
Here is the pattern:
from langchain_anthropic import ChatAnthropic
from langchain_core.messages import SystemMessage, HumanMessage
from langgraph.graph import StateGraph, MessagesState

# STATIC — defined once at module level, never modified
SYSTEM_PROMPT = SystemMessage(content=[
    {
        "type": "text",
        "text": """You are a production coding assistant.
Follow the user's coding standards.
Always run tests before committing.
Never delete files without confirmation.""",
        "cache_control": {"type": "ephemeral"}
    }
])

model = ChatAnthropic(model="claude-sonnet-4-20250514")

def call_model(state: MessagesState):
    # System prompt prepended identically every time
    response = model.invoke([SYSTEM_PROMPT] + state["messages"])
    return {"messages": [response]}
The cache_control field on the content block tells Anthropic to cache up to this point. Since the SystemMessage is defined once and referenced by the same object, the content is identical on every request.
For longer system prompts, or if you want to avoid managing cache breakpoints manually, AnthropicPromptCachingMiddleware handles it:
from langchain_anthropic.middleware import AnthropicPromptCachingMiddleware

agent = create_agent(
    model=ChatAnthropic(model="claude-sonnet-4-20250514"),
    system_prompt=LONG_SYSTEM_PROMPT,
    middleware=[AnthropicPromptCachingMiddleware(
        type="ephemeral",
        ttl="5m",
        min_messages_to_cache=0,
    )],
    tools=tools,
    checkpointer=checkpointer,
)
The middleware intercepts each model request and automatically places cache_control breakpoints on the appropriate messages. It implements incremental conversational caching, so as the conversation grows, the breakpoints advance with it. This is the same behavior as Anthropic's automatic caching mode, but wired into the LangChain request pipeline.
The middleware approach is cleaner for most production setups. The explicit cache_control approach is useful when you want fine-grained control over exactly where breakpoints sit, for example when you have a very large tool set and a moderately large system prompt and you want to cache them at different depths.
Rule 2: Never Mutate Tools Mid-Session#
Tool definitions come before the system prompt in Anthropic's serialization order. If you change the tool set between requests, you invalidate the system prompt cache and the message cache. Everything downstream of the tools becomes a cache miss.
Bind tools at graph definition time, not inside the node:
tools = [search_tool, code_tool, file_read_tool, file_write_tool,
         enter_plan_mode, exit_plan_mode]  # ALL tools, always present

model_with_tools = model.bind_tools(tools)

# For explicit cache_control on the last tool:
from langchain_anthropic import convert_to_anthropic_tool

anthropic_tools = [convert_to_anthropic_tool(t) for t in tools]
anthropic_tools[-1]["cache_control"] = {"type": "ephemeral"}
model_with_cached_tools = model.bind_tools(anthropic_tools)
Placing the cache_control breakpoint after the last tool definition is a standard pattern. It tells the model to cache everything up to and including the full tool list. Since tool definitions are usually the bulkiest part of the prefix and the least likely to change mid-session, this is almost always the right place for a breakpoint.
The anti-pattern I see most often is mode switching via different tool sets:
# BAD — different tool sets, separate cache entries
planning_model = llm.bind_tools([search_tool, plan_tool])
execution_model = llm.bind_tools([execute_tool, verify_tool])

# GOOD — same tools everywhere, route by state
model_with_all_tools = model.bind_tools(all_tools)
Each unique tool configuration is a separate cache entry. If you have two models with different tool sets, they will never share a cache entry, even if the system prompt is identical.
For mode switching in LangGraph, use Command with routing logic instead:
from langgraph.types import Command

@tool
def enter_plan_mode(reasoning: str) -> Command:
    """Switch to planning mode. Explain why planning is needed."""
    return Command(
        goto="plan_node",
        update={"current_mode": "plan", "plan_reasoning": reasoning}
    )
The graph routes differently based on state, but the model always sees the same tools. The cache is preserved across mode transitions.
Rule 3: Dynamic Context via Messages, Not the System Prompt#
Any content that changes between requests needs to go in the messages, not in the system prompt. This includes the current time, working directory, git branch, environment variables, per-request user preferences.
A clean pattern is injecting dynamic context as a HumanMessage at the start of the message list, after the static system prompt:
def call_model(state: MessagesState):
    dynamic_context = HumanMessage(content=f"""<system-reminder>
# Current State
- Date: {datetime.datetime.now().isoformat()}
- Working directory: {state.get('cwd', '.')}
- Git branch: {state.get('branch', 'main')}
</system-reminder>""")

    messages = [SYSTEM_PROMPT, dynamic_context] + state["messages"]
    response = model_with_tools.invoke(messages)
    return {"messages": [response]}
The system prompt stays frozen. Dynamic context gets a dedicated slot in the message list where it is expected to change.
For runtime parameters that should not pollute graph state, use configurable from RunnableConfig:
from langchain_core.runnables import RunnableConfig

def call_model(state: MessagesState, config: RunnableConfig):
    user_prefs = config["configurable"].get("user_preferences", {})
    # Build dynamic context from config, not from state
If you want to go further and automate cache placement on the conversation tail, you can write a custom message reducer:
from langgraph.graph.message import add_messages
from typing import Annotated

def cache_aware_reducer(left: list, right: list) -> list:
    """Auto-add cache_control to the last user message."""
    for i in range(len(right) - 1, -1, -1):
        if right[i].type == "human":
            if isinstance(right[i].content, list):
                right[i].content[-1]["cache_control"] = {"type": "ephemeral"}
            else:
                right[i].content = [
                    {"type": "text", "text": right[i].content,
                     "cache_control": {"type": "ephemeral"}}
                ]
            break
    return add_messages(left, right)

class CacheAwareState(TypedDict):
    messages: Annotated[list, cache_aware_reducer]
This wires cache breakpoints into the state update logic, so every time a new human message gets added to state, it automatically gets a cache annotation on the last content block. Combined with a static system prompt and frozen tools, this gives you three cache breakpoints placed correctly with no per-call configuration.
Rule 4: Cache-Safe Compaction in LangGraph#
Context compaction is where prompt caching goes wrong in ways that are hard to notice. You compact the conversation, the cache misses for the next several turns while it rebuilds, and you never connect the compaction event to the cost spike.
LangGraph has built-in summarization via langmem:
from langmem.short_term import summarize_messages, RunningSummary

class CompactableState(MessagesState):
    summary: RunningSummary | None

def compact_and_call(state: CompactableState):
    result = summarize_messages(
        state["messages"],
        running_summary=state.get("summary"),
        token_counter=model.get_num_tokens_from_messages,
        model=ChatAnthropic(model="claude-sonnet-4-20250514"),  # Same model — critical
        max_tokens=256,
        max_tokens_before_summary=256,
        max_summary_tokens=128,
    )
    response = model_with_tools.invoke(
        [SYSTEM_PROMPT] + result.messages  # Same system prompt prefix
    )
    return {
        "messages": [response],
        "summary": result.running_summary
    }
Two things matter here. First, the summarization model call must use the same model as the main graph. This is not about cache sharing between the compaction call and the main call. It is about predictable token counting and consistent output format for the summary, which then gets embedded into the main graph's message history. Second, and more important, the main call after compaction still uses SYSTEM_PROMPT as the first element. The prefix is identical. The cache hit on the system prompt and tools survives the compaction.
The failure mode is writing a separate summarization agent with different instructions. As soon as the prefix changes, the next model call in the main graph is a cold start.
LangGraph's interrupt() introduces another wrinkle. When the graph pauses for human input, the cache TTL keeps running. If the user takes six minutes to respond and you are using the default 5-minute TTL, the cache has evicted by the time the graph resumes. The fix is to use 1-hour TTL for interrupt-heavy workflows:
AnthropicPromptCachingMiddleware(ttl="1h")
This costs 2x the write price instead of 1.25x, but for a 30-turn session with minutes-long human pauses, it is usually the right tradeoff. The alternative is paying for a cache rebuild on every turn after each interrupt().
You can read cache metrics from response.usage_metadata on the LLM response object. Check cache_read_input_tokens and cache_creation_input_tokens directly there.
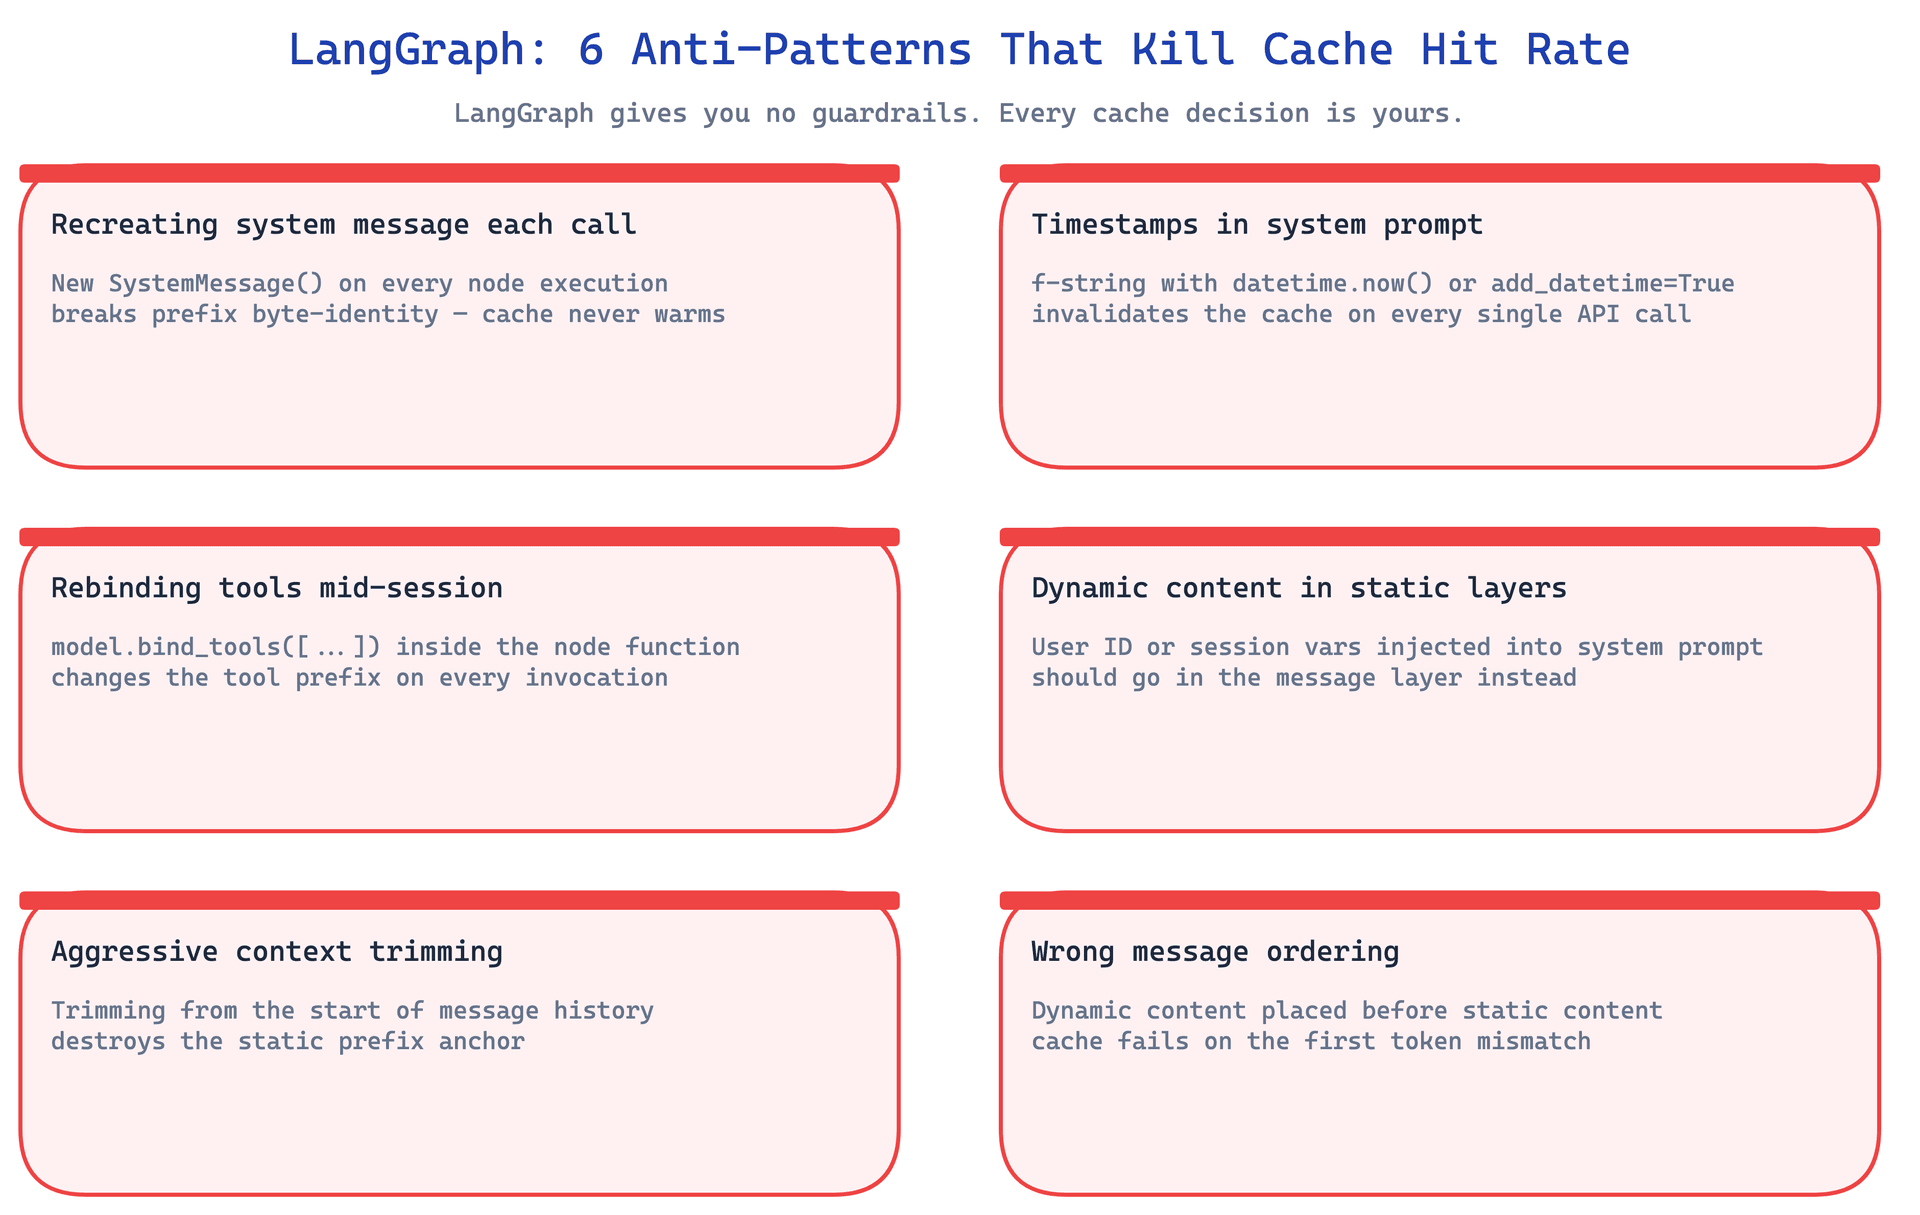
The Six Anti-Patterns#
These are mistakes I have made or watched teammates make. Most of them are not obvious when you first write the code. They only show up in the cost numbers.
Anti-Pattern 1: Timestamp in the System Prompt#
This is probably the most common cache-busting mistake, and also the hardest to notice because the agent still works correctly. A timestamp in instructions or description changes every second. Your cache hit rate is zero. Your costs are maximum. And nothing in the agent's behavior tells you this is happening.
# BAD
agent = Agent(instructions=[f"Current time: {datetime.now()}. You are helpful."])

# GOOD
agent = Agent(
    instructions=["You are helpful."],
    add_datetime_to_instructions=False,
)
# Time goes in the user message instead
The same pattern applies to any session-specific information: user IDs, request IDs, per-session configuration strings. If it changes, it does not belong in the system prompt.
Anti-Pattern 2: Adding Tools Mid-Session#
Adding a tool after the session has started invalidates the entire cache. Not just the tool portion. Everything. The tools come first in serialization order, so any change there cascades.
# BAD
if user_wants_slack:
    agent.add_tool(SlackTool())  # Invalidates ENTIRE cache

# GOOD — all tools present from start, lazy-loaded if expensive
agent = Agent(tools=[SlackTool(), GitHubTool(), JiraTool(), ToolSearchTool()])
If some tools are expensive to initialize, you can lazy-load the underlying connections inside the tool functions rather than adding the tools themselves dynamically. The tool schema stays in the prefix from turn one. The actual connection is not made until the tool is called.
Anti-Pattern 3: Swapping Tool Sets for Mode Switching#
Related to anti-pattern 2 but slightly different. This one does not add tools mid-session. It uses different tool configurations for different nodes or modes, which means different cache entries for the same session.
# BAD
plan_model = llm.bind_tools([read_tool, search_tool])
exec_model = llm.bind_tools([write_tool, exec_tool])

# GOOD
all_tools_model = llm.bind_tools([read_tool, search_tool, write_tool, exec_tool,
                                   enter_plan_mode, exit_plan_mode])
The cost of having extra tools in the prefix is small. The cost of having two separate cache entries instead of one shared entry is not small. In a 50-turn session split between two modes, you pay for two cold starts and never get the benefit of a warm cache.
Anti-Pattern 4: Switching Models Mid-Session#
This one feels like a reasonable optimization. Use Haiku for simple questions, Opus for complex reasoning. But each model has its own KV cache. Switching models is a cold start.
# BAD
if is_simple_question:
    agent.model = Claude(id="claude-haiku-4-20250506")  # Cold-start cache write

# GOOD — use a subagent with its own independent cache
if needs_quick_lookup:
    lookup_agent = Agent(
        model=Claude(id="claude-haiku-4-20250506"),
        instructions=["Answer this specific question concisely."],
    )
    result = lookup_agent.run(specific_question)
The subagent approach is actually cleaner in other ways too. The main agent maintains its warm cache. The lookup subagent is a separate, short-lived session. If the lookup subagent runs frequently enough, it will build its own warm cache. The two sessions are independent rather than competing.
Anti-Pattern 5: Compaction with a Different System Prompt#
I described this one above but it deserves its own spot in the list because I have seen it trip up multiple people. The instinct is to write a dedicated summarizer with concise summarization instructions. Those instructions are different from the parent agent's system prompt. Cache miss.
# BAD
summary_agent = Agent(
    instructions=["You are a summarizer."],  # Different prefix, no cache reuse
)

# GOOD — identical prefix
summary_agent = Agent(
    description=parent_agent.description,
    instructions=parent_agent.instructions,
    tools=parent_agent.tools,  # Same tools — most important part
)
The tool list is the most important part to preserve. Tools are often 80% of the prefix by token count. Matching the description and instructions with different tools still results in a completely different cache entry.
Anti-Pattern 6: Non-Deterministic Tool Ordering#
This one is subtle. If tools are stored in a set (or any other unordered data structure), the order in which they appear in the serialized request is not guaranteed across Python versions or even across runs. Different orderings hash to different cache keys.
# BAD
tools = {get_weather, get_time, search}  # Set — order not guaranteed

# GOOD
tools = [get_weather, get_time, search]  # List — order guaranteed
The same issue can appear with dictionary key ordering in older Python versions, or with tools that get sorted by some criteria that changes. Keep your tool list a literal list, defined in a fixed order, at module level.
Monitoring and Alerting in Production#
Without instrumentation, you will not know your cache is broken until you see the bill. By then it has been broken for days.
Instrument every API call with the cache metrics:
metrics = {
    "cache_read_tokens": response.usage.cache_read_input_tokens,
    "cache_write_tokens": response.usage.cache_creation_input_tokens,
    "uncached_tokens": response.usage.input_tokens,
    "output_tokens": response.usage.output_tokens,
}

total_input = (metrics["cache_read_tokens"] +
               metrics["cache_write_tokens"] +
               metrics["uncached_tokens"])

cache_hit_rate = metrics["cache_read_tokens"] / total_input if total_input > 0 else 0

# Cost calculation (Sonnet pricing)
actual_cost = (
    metrics["cache_read_tokens"] * 0.30 / 1_000_000 +
    metrics["cache_write_tokens"] * 3.75 / 1_000_000 +
    metrics["uncached_tokens"] * 3.00 / 1_000_000 +
    metrics["output_tokens"] * 15.00 / 1_000_000
)
Emit these as time-series metrics per session and per agent type. The per-session view is the diagnostic tool. The per-agent-type view is the operational dashboard.
Alert thresholds worth setting:
Cache hit rate below 80% is a warning. Investigate whether system prompts or tools are being mutated between requests. Cache hit rate below 50% is critical. Something is breaking the prefix on most turns.
If cache_write_tokens > cache_read_tokens for three or more consecutive turns after turn one, that is a warning. The cache is being rebuilt on every turn instead of being read. A common cause is an unintended dynamic element in the prefix that gets noticed as a miss, triggers a write, never generates a hit because the prefix changes again on the next turn.
If cache_creation_input_tokens > 0 on turn N where N is greater than one and you did not intentionally compact, investigate. The prefix changed. Use the full request payload from that turn compared to the previous turn to find the diff.
If cost per turn is increasing linearly with conversation length, the cache is not working at all. A healthy session has relatively flat cost per turn from turn two onward: the stable prefix is cached, and only the incremental new messages are processed fresh.
Per-session diagnostic pattern:
Track a time series per session: cache hit rate, total tokens, cost, latency. Turn one will always show cache_creation_input_tokens > 0 because the cache is cold. Every subsequent turn should show cache_read_input_tokens dominating and cache_creation_input_tokens at zero or near zero.
A sudden spike in cache_creation_input_tokens mid-session indicates a cache-busting event. Something changed in the prefix. Correlate the spike with the timeline to find the event. Common culprits are a tool being added, a config update that touched the system prompt, or a mode switch that ended up using a different model.
The difference between a 10% cache hit rate and a 90% cache hit rate is roughly a 5x cost reduction on a long-running session. For a session with a 100K-token stable prefix running 50 turns, the gap between those two scenarios is not marginal. Getting the monitoring right means you find out when caching breaks in hours instead of weeks. Given how many ways there are to break it, that matters.
If you are building multi-agent systems, each agent in the graph has its own prefix and its own cache state. You will want per-agent metrics, not just per-session totals. An orchestrator agent and a subagent with different system prompts will have independent cache behaviors. The patterns in building multi-agent systems and long-running agent harnesses apply here: treat each agent as an independent unit with its own cache budget and its own hit rate target.
That is the full picture for LangGraph prompt caching. The framework gives you control and nothing else. The patterns above are mostly about discipline: define things once, freeze what should be frozen, and put dynamic content where it belongs.
FAQ#
How does AnthropicPromptCachingMiddleware interact with explicit cache_control breakpoints I have already set?
The middleware adds its own breakpoints on top of whatever explicit ones you have placed. Anthropic allows up to four cache breakpoints per request. The middleware uses one of those slots. So if you have placed explicit breakpoints on three content blocks and then apply the middleware, you are at the limit. The middleware's automatic breakpoint may also conflict with your explicit placement if it picks a different position in the message list. In practice, the cleanest approach is to use one or the other but not both. Use explicit breakpoints when you need precise control over which blocks get cached. Use the middleware when you want it handled automatically across the full conversation.
In LangGraph, if I use a subgraph, does each subgraph share the same cache as the parent graph?
No. Cache entries are keyed by the full request payload sent to the Anthropic API, which includes the specific prefix of that call. A subgraph node that calls the model with a different set of messages (or different tools, or a different system prompt) will have a cache entry that is completely separate from the parent graph's cache. If you want a subgraph to share the parent's cache, it needs to send an identical prefix, which means the same tools in the same order and the same system prompt content. In most cases, subgraphs have specialized instructions and a smaller tool set, so they will have their own independent caches. That is fine as long as each subgraph maintains internal prefix stability.
How do I debug which specific change caused a cache miss in production?
The most direct approach is to log the full serialized request payload at the point of the model call, keyed by session ID and turn number. When you see cache_creation_input_tokens > 0 on a turn where you expected a cache hit, compare the serialized payload from that turn with the previous turn. The diff will show you the exact change. In LangGraph, you can add a custom callback to the model call to capture this. For less intrusive debugging, log the hash of the prefix separately, and alert when the hash changes mid-session. You do not need the full payload in the alert, just the fact that something changed and when.
What is a realistic cache hit rate target for a production agent with 50+ turns per session?
Turn one is always a cache miss (cold start). After that, with a correctly implemented static prefix, you should see cache hit rates of 90% or higher on a per-turn basis by turn three or four. At 50 turns, the amortized hit rate across the session should be above 95% if nothing in your prefix changes. The reason it is not 100% is that your dynamic content (the growing message tail after the last cache breakpoint) is not cached. That portion gets processed fresh on every turn. So the effective cache hit rate depends on the ratio of stable prefix tokens to dynamic tail tokens. A 100K-token system prompt with a 500-token message tail will have very high hit rates. A 1,000-token system prompt with a 50,000-token growing conversation might see lower effective hit rates as the tail grows beyond the last breakpoint.
Does the cache_aware_reducer approach work with LangGraph's built-in add_messages reducer?
Yes. The cache_aware_reducer defined above calls add_messages as its final step, so you get all of LangGraph's normal message deduplication and ordering logic. The custom reducer just adds a pre-processing step that annotates the last human message in the incoming batch. One thing to watch: if the incoming message already has a cache_control field on its last content block (for example if you set it explicitly before adding to state), the reducer will overwrite it. That is usually fine, but be aware of the behavior if you are mixing explicit annotations with the reducer.
Is there a way to warm the cache before users start a session?
Yes, with a warm-up call. Before the first real user turn, send a single API request with your full static prefix (tools plus system prompt) and a minimal human message like a single token. This call will be billed at cache write prices and will take the full time to process. But subsequent turns in the session will hit a warm cache from the first real user message. For agents with very large prefixes where cold-start latency is noticeable to the user, this is worth doing. The warm-up call can happen in parallel with loading the UI or fetching other session setup data. With 1-hour TTL, you can warm the cache when the user opens the application and have it ready for their first interaction.