I lost three days to a bug that, in retrospect, should have taken four minutes to find.
The agent was a retrieval-augmented generation pipeline. Nothing exotic. User asks a question, the agent queries a vector database, retrieves relevant chunks, feeds them into the context window, generates an answer. It had been working fine for weeks. Then, quietly, the answers started degrading. Not failing. Degrading. The agent still responded. The responses were grammatically correct, confident, and increasingly wrong.
The observability gap in AI agents is not a theoretical problem. It is a "three days of staring at logs that do not exist" problem. And it is one that almost every team building agents right now is going to hit.
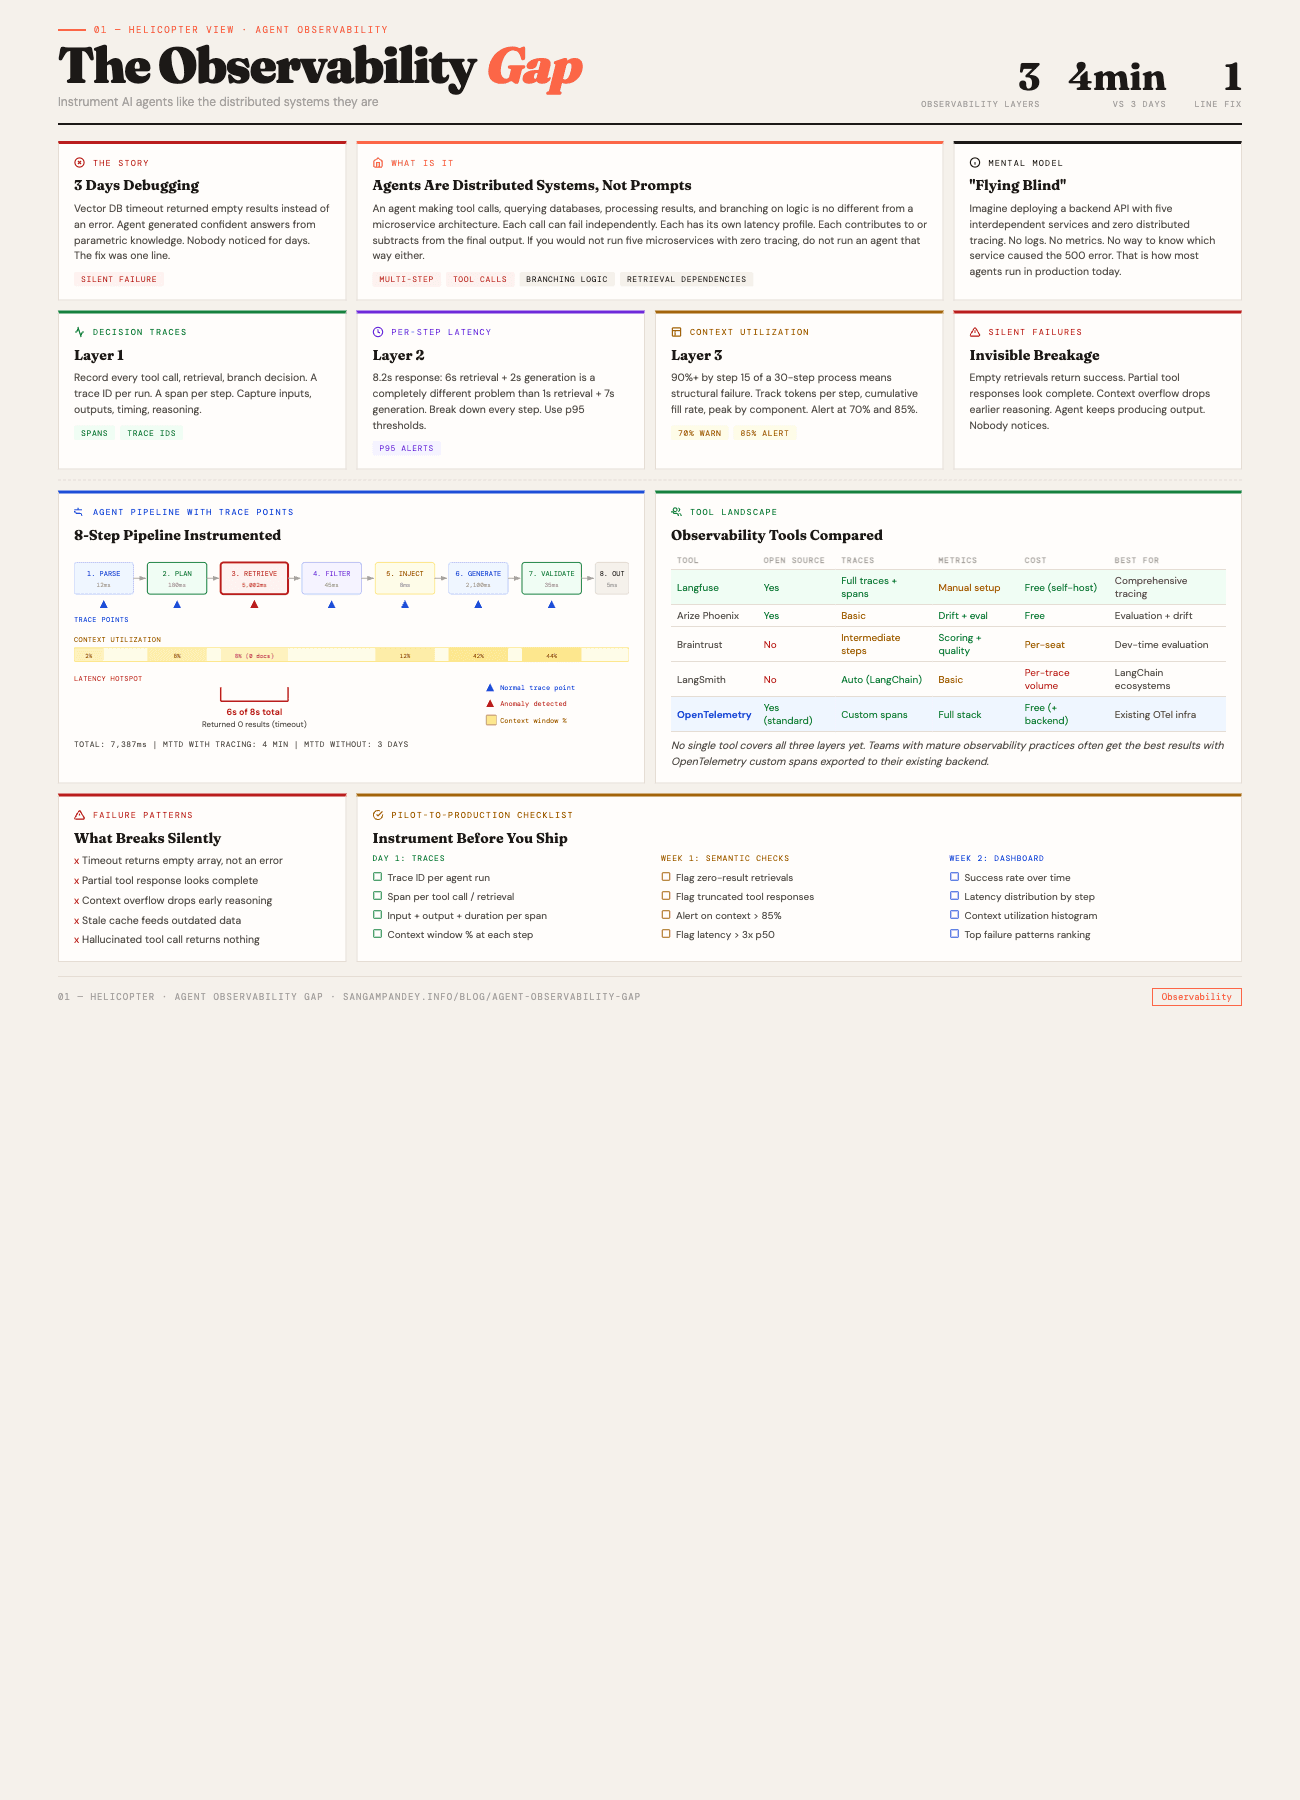
For a visual guide to the three observability layers, see the Agent Observability Gap infographic.
Table of Contents#
- The vector DB timeout story
- What is the agent observability gap?
- How do you trace AI agent decisions?
- Silent failure patterns that will ruin your week
- What tools exist for agent observability?
- Building observability from day one
- The pilot-to-production gap
- Mean time to diagnose as the key metric
- FAQ
The Vector DB Timeout Story#
Here is what happened. The vector database had a query timeout set to 5 seconds. Under normal load, queries returned in 200 to 400 milliseconds. No problem. But as the dataset grew and certain queries hit denser regions of the embedding space, some retrievals started taking longer. When a query exceeded 5 seconds, the database client did not throw an error. It returned an empty result set.
Read that again. It returned an empty result set. Not an error. Not a timeout exception. An empty array. Success status code. Zero documents.
The agent received this empty array and did what any well-behaved language model does when given no context: it generated an answer from its parametric knowledge. The answer was plausible. Sometimes even correct. But it was no longer grounded in the actual data the system was supposed to reference. The retrieval step had silently become a no-op, and nobody noticed for days.
I found it by accident. I was profiling something unrelated and noticed a retrieval call that took 5,002 milliseconds and returned zero results. That pattern, sitting right there in the timing data, would have been obvious on day one if I had been tracing per-step latency. I was not.
The fix was one line. Increase the timeout. Or, better, add a check: if a retrieval returns zero results in a domain where zero results is semantically impossible, treat it as an error. Either way, it was trivial. The three days of confused debugging were not.
This is the observability gap. Not a missing feature. A missing discipline.
Key takeaway: 3 days of debugging became a 4-minute diagnosis once tracing was in place. The fix was one line of code. The cost of not having observability was 3 days of engineering time.
What Is the Agent Observability Gap?#
There is a mental model problem that creates the observability gap, and it starts with how most people think about agents.
If you think of an agent as "a prompt that calls an API," you will treat its failure modes the way you treat prompt failures. You will look at the output, decide it is wrong, tweak the prompt, and try again. This works when the agent is simple. It breaks completely when the agent has multiple steps, multiple tools, branching logic, and retrieval dependencies.
An agent making a decision, calling a tool, processing the result, deciding what to do next, calling another tool, and assembling a response is not conceptually different from a microservice architecture. The calls are just to different kinds of endpoints. Some are LLM inference calls. Some are database queries. Some are API requests. Some are file reads. Each one can fail independently. Each one has its own latency profile. Each one contributes to, or subtracts from, the final result.
If you built a microservice system with five interdependent services and zero distributed tracing, your team would revolt. Nobody would accept that. But right now, most agent systems in production have exactly that setup. No tracing. No per-step metrics. No way to know which step in a ten-step agentic loop caused the output to go sideways.
The reason I keep coming back to the five pillars of agentic engineering is that observability touches every single one. Context engineering breaks silently when retrieval degrades. Agentic validation is useless if you cannot trace which validation step missed the problem. Tooling fails in ways that look like model failures. And compound engineering, the compounding value of shared agent infrastructure, compounds the debugging problem too when you have no way to trace causality across the system.
This is not an analogy. Agents are distributed systems. The sooner you treat them that way, the sooner you stop losing days to problems that should take minutes.
Key takeaway: An agent is not a prompt. It is a distributed system. If you would not run five microservices with zero distributed tracing, do not run an agent that way either.
How Do You Trace AI Agent Decisions?#
I think about agent observability in three layers. You need all three. Having one or two is better than nothing, but the gaps between them are exactly where the worst bugs hide.
Layer 1: Decision Traces#
A decision trace is a record of every significant action the agent took during a run. Every tool call. Every retrieval. Every branching decision. Every time the agent chose path A over path B.
This is the equivalent of distributed tracing in a microservice system. You want a trace ID for every run, and under that trace, a span for every step. The span should capture: what the agent decided to do, what inputs it provided, what outputs it received, and how long it took.
The reason decision traces matter is that agent failures are rarely single-point failures. The vector DB timeout story is a good example. The failure was not in the retrieval step alone. The failure was that the retrieval step returned empty, the agent accepted the empty result without flagging it, and then generated a confident answer from nothing. Three things went wrong in sequence. Without a trace that shows the full sequence, you are guessing which one to fix.
Decision traces also capture something that traditional logging misses: the agent's reasoning about what to do next. In a multi-step agent, the model often emits a plan or a rationale before taking action. Capturing that plan is valuable because it lets you see, after the fact, whether the agent's reasoning was sound even when the output was wrong. That distinction matters. A wrong answer from good reasoning points you toward a data or tool problem. A wrong answer from bad reasoning points you toward a prompt or context problem.
Practically, a decision trace for a single agent run might look like this:
Trace: run_abc123
├─ Span: parse_user_query (12ms)
│   input: "What were Q3 revenue figures for Project Alpha?"
│   output: {intent: "data_retrieval", entity: "Project Alpha", period: "Q3"}
├─ Span: vector_search (5,002ms) ← suspicious
│   input: {query_embedding: [...], top_k: 5, collection: "financial_docs"}
│   output: {results: [], count: 0}  ← empty
├─ Span: llm_generation (2,100ms)
│   input: {context_documents: 0, query: "..."}
│   output: "Based on available information, Q3 revenue..."
│   context_window_usage: 12%
└─ Total: 7,114ms
Looking at that trace, the problem jumps out. The retrieval took 5 seconds and returned nothing. The generation happened with zero context documents. You do not need to be an expert to see it. You just need the trace to exist.
Layer 2: Per-Step Latency Metrics#
This is the layer most people skip, and it is the one that would have saved me three days.
Aggregate latency is easy to measure. "The agent responded in 8.2 seconds." That is your response time. Most teams measure this. Few teams break it down further.
But an 8.2-second response where 6 seconds is retrieval and 2 seconds is generation is a completely different problem from an 8.2-second response where 1 second is retrieval and 7 seconds is generation. The first one tells you your retrieval infrastructure has a problem. The second tells you your prompt is probably too large or your model selection might be wrong.
Per-step latency means attaching a timer to every span in your decision trace. Not just the total. Every step. And then setting up thresholds that flag anomalies.
The thresholds are where this gets interesting. You do not want static thresholds. A retrieval call that takes 3 seconds might be normal for a large collection and abnormal for a small one. What you want is percentile-based alerting. If the p95 retrieval latency for a given collection is 400ms and a call takes 5,000ms, that should be a signal regardless of whether 5 seconds is "a lot" in absolute terms.
For teams running agents with multiple tool calls, per-step latency reveals something else: the bottleneck. I have seen agents where the total response time was 12 seconds and 9 of those seconds were a single API call to an external service that nobody had thought to cache. The fix was a thirty-minute caching layer. The diagnosis, without per-step latency, took two weeks of intermittent investigation.
This connects directly to the work of building harnesses for long-running agents. When an agent runs across multiple sessions, you accumulate latency data over time. A retrieval step that was 200ms in session one and is 2,000ms by session fifteen is a clear signal that something has changed. Without per-step latency tracking, that degradation is invisible until it becomes a failure.
Layer 3: Context Window Utilization Monitoring#
This is the observability layer that almost nobody has right now, and it might be the most important one for agents that run multi-step loops.
Every language model has a finite context window. Every step the agent takes consumes some of it. Retrieval results get injected. Tool outputs get appended. Previous conversation turns accumulate. The agent's own reasoning adds tokens. And at some point, the context window starts getting full.
What happens when an agent's context window is at 90% utilization? The model starts dropping information. Depending on the implementation, it might truncate older messages. It might summarize. It might just start ignoring parts of the context that do not seem immediately relevant. The result is the same: the agent's behavior degrades in ways that are hard to predict and harder to debug.
I have seen this pattern repeatedly in multi-agent systems. Agent A gathers information, passes it to Agent B, which gathers more, passes it to Agent C. By the time Agent C is working, the combined context from A and B plus C's own tool calls has pushed the window to 85%. Agent C starts making decisions that do not account for things Agent A found, because those tokens are now outside the attention window or have been truncated.
Context window utilization monitoring means tracking, at every step, what percentage of the available context window is consumed. And then alerting when it crosses thresholds. I use 70% as a warning and 85% as a hard alert. If your agent is hitting 85% context utilization by step 15 of a 30-step process, you have a structural problem. No amount of prompt tuning will fix it.
The metrics you want:
- Tokens consumed per step. How much context does each tool call or retrieval add?
- Cumulative utilization over time. A chart showing context window fill rate across the agent's run.
- Peak utilization by component. Which retrieval source or tool is contributing the most tokens?
- Utilization at decision points. What was the context fullness when the agent made key decisions?
This data lets you make informed decisions about context engineering. Maybe you need to summarize retrieval results before injecting them. Maybe you need to limit the number of tool outputs retained in context. Maybe you need to split the work across multiple agents with separate context windows. All of those are valid strategies, but you cannot choose intelligently without the data.
Silent Failure Patterns That Will Ruin Your Week#
The vector DB timeout was one silent failure pattern. There are several others that I have either encountered or heard about from other teams building agents in production. Each one shares a common trait: the agent continues to produce output, so nobody notices the failure until the output quality has degraded enough to be obviously wrong.
Empty Retrievals#
This is the one I already described, but it is worth formalizing. Any retrieval step that returns zero results in a domain where zero results should not happen is a failure. The problem is that most agent frameworks treat zero results as a valid response. The agent proceeds. It generates from parametric knowledge. The output looks fine.
The fix is a semantic check: does zero results make sense for this query? In most production systems, the answer is no. If someone asks about a document that should exist in your knowledge base, and retrieval returns nothing, that is an error condition. Instrument it that way.
Partial Tool Responses#
This one is subtler. A tool call returns a response, but the response is incomplete. Maybe the API paginated the results and the agent only got the first page. Maybe the tool hit a rate limit and returned partial data with a 200 status code. Maybe the response was truncated by the tool's own output limits.
The agent does not know the response is partial. It treats whatever it received as the complete answer. Decisions get made on incomplete data. The output is wrong, but not in a way that looks obviously wrong.
Per-step tracing catches this when you log the full response body. You can see that the tool returned 10 results when the total count was 250. You can see that the response was truncated at 4,096 characters. Without the trace, you have no idea.
Context Overflow Degradation#
I mentioned this in the context window section, but it deserves its own entry because it is so common and so hard to catch without instrumentation.
The pattern: the agent works well for the first ten steps. By step fifteen, the context window is above 90%. The agent starts producing outputs that subtly ignore earlier information. By step twenty, the agent is effectively operating without the context from steps one through five. The final output is wrong because the agent forgot its own earlier work.
This looks like a model quality problem. It is not. It is an architecture problem. And it is only visible if you are tracking context utilization.
Stale Cache Hits#
If you cache retrieval results or tool outputs for performance (and you should), stale caches are a failure mode. The underlying data changes, the cache does not refresh, and the agent operates on outdated information. The agent's output is consistent with its inputs. The inputs are just wrong.
This is standard distributed systems territory. TTL policies, cache invalidation, versioning. The difference with agents is that the cache is feeding a probabilistic system. A slightly stale input does not cause a crash. It causes a subtly wrong answer that nobody catches until a user complains.
Hallucinated Tool Calls#
This one is specific to agents that decide which tools to call. The agent attempts to call a tool that does not exist, or calls a real tool with parameters that make no sense. Some frameworks silently catch these and return empty results. The agent proceeds as if the tool call worked.
Decision traces catch this immediately. Without them, you see a wrong answer and have no idea why. The actual cause, a hallucinated tool name or malformed parameters, is buried in the agent's internal state that you never logged.
What Tools Exist for Agent Observability?#
The good news is that the observability tooling for agents is maturing quickly. The bad news is that no single tool covers all three layers yet. Here is what I have evaluated or used.
Agent Observability Tools Comparison#
| Tool | Open Source | Traces | Metrics | Cost | Best For |
|---|---|---|---|---|---|
| Langfuse | Yes | Full traces + spans | Manual setup | Free (self-host) | Comprehensive tracing |
| Arize Phoenix | Yes | Basic | Drift + eval | Free | Evaluation + drift detection |
| Braintrust | No | Intermediate steps | Scoring + quality | Per-seat | Dev-time evaluation |
| LangSmith | No | Auto (LangChain) | Basic | Per-trace volume | LangChain ecosystems |
| OpenTelemetry | Yes (standard) | Custom spans | Full stack | Free (+ backend) | Existing OTel infrastructure |
Langfuse#
Open-source, self-hostable, and the most complete agent-specific observability platform I have found. Langfuse gives you traces, spans, generations, and a scoring system. It integrates with LangChain, LlamaIndex, and raw OpenAI/Anthropic SDK calls. The trace view is close to what I described above: a hierarchical view of every step in the agent's run, with timing, inputs, outputs, and cost.
Where Langfuse falls short is on the alerting side. You can see the traces, but setting up automated alerts for anomalies (like a retrieval step that takes 10x longer than usual) requires additional infrastructure. The trace data is there. The alerting pipeline is not built in.
Arize Phoenix#
Arize is focused more on evaluation and drift detection than on per-run tracing. It is good at answering "is the agent getting worse over time?" but less good at answering "what went wrong in this specific run?" The embedding visualization tools are useful for understanding retrieval quality at a macro level.
For teams that have basic tracing already and need to add evaluation, Arize fills a real gap. For teams starting from zero observability, I would not start here.
Braintrust#
Braintrust positions itself as an evaluation platform. It is strong on scoring agent outputs against expected results and tracking quality over time. The logging infrastructure is solid and it has good support for capturing intermediate steps.
The approach is more experiment-oriented than operations-oriented. It is excellent for development-time evaluation, where you are iterating on prompts and tools and want to measure whether changes improve output quality. It is less optimized for production monitoring of live agent systems.
LangSmith#
LangSmith is LangChain's observability platform. If you are already using LangChain, it is the path of least resistance. Traces are automatically captured for LangChain runs. The UI for exploring traces is good.
The limitation is the tight coupling to the LangChain ecosystem. If your agents are built on a different framework, or if you are using raw SDK calls, the integration requires more work. And the pricing model scales with trace volume, which can get expensive for high-throughput production systems.
OpenTelemetry Custom Spans#
This is not a product. It is a standard. And for teams with existing observability infrastructure built on OpenTelemetry, it might be the best option.
The idea is straightforward: wrap every agent step in an OpenTelemetry span. Add attributes for input tokens, output tokens, context window utilization, retrieval result counts, and anything else relevant. Export the spans to whatever backend you already use, whether that is Jaeger, Grafana Tempo, Datadog, or Honeycomb.
The advantage is integration with your existing monitoring stack. The disadvantage is that you are building the instrumentation yourself. There is no built-in understanding of agent semantics. You have to decide what to trace, how to structure the spans, and what attributes matter.
For teams that already operate distributed systems and have mature observability practices, this is often the best choice. You are extending a system you already know rather than adopting a new one.
Building Observability From Day One#
Here is my practical advice for teams building new agent systems, or adding observability to existing ones.
Start With Traces#
Before metrics, before dashboards, before alerts. Just get traces. Log every step the agent takes: what it decided to do, what input it sent, what output it received, how long it took. Store these traces somewhere you can query later.
This does not need to be sophisticated. A structured log line per step, written to a file or a database, is enough to start. The important thing is that every run produces a traceable record of what happened.
interface AgentSpan {
  traceId: string;
  spanId: string;
  parentSpanId: string | null;
  stepType: "retrieval" | "tool_call" | "llm_generation" | "decision";
  startTime: number;
  endTime: number;
  input: Record<string, unknown>;
  output: Record<string, unknown>;
  contextWindowUtilization: number;
  metadata: Record<string, unknown>;
}
That is the minimum viable trace schema. It captures what happened, when, how long it took, and how full the context window was at that point.
Add Semantic Checks#
After traces, add checks that encode domain knowledge about what should and should not happen.
- Retrieval returned zero results? Flag it.
- Tool call returned a response shorter than 50 characters for a query that should produce detailed output? Flag it.
- Context window utilization jumped by more than 30% in a single step? Flag it.
- Total agent run took more than 3x the p50 for similar queries? Flag it.
These checks run after each step and write to the trace. They do not block the agent. They add annotations that surface during review.
Build a Health Dashboard#
Once you have traces and semantic checks, build a dashboard. It does not need to be pretty. It needs to show four things:
- Success rate over time. What percentage of agent runs produced output that passed all semantic checks?
- Latency distribution by step type. How long does each type of step take, and is it getting worse?
- Context window utilization distribution. What percentage of runs hit 70%? 85%? 95%?
- Top failure patterns. Which semantic checks fire most often?
This dashboard becomes the first thing you check when someone reports that the agent is producing bad output. Instead of starting a three-day investigation, you open the dashboard, see that retrieval latency spiked yesterday, and know exactly where to look.
Instrument Before You Optimize#
This is the point I want to emphasize most. The instinct when an agent produces bad output is to change the prompt. To adjust the retrieval parameters. To swap the model. Those might be the right fixes. But without observability, you are guessing.
The discipline of agent observability is the discipline of not guessing. Instrument first. Look at the data. Then decide what to change. This is not different from how we approach any other system in production. The only new thing is applying the same rigor to AI agents.
The Pilot-to-Production Gap#
There is a specific moment in every agent project where observability becomes critical, and it is the transition from pilot to production.
In a pilot, the builder is watching. They run the agent. They look at the outputs. They notice when something is off because they are paying attention. The observability is the human.
In production, nobody is watching. The agent runs hundreds or thousands of times a day. The outputs go to users. The builder is working on the next feature. And the silent failures, the empty retrievals, the context overflows, the partial tool responses, they accumulate.
I have seen this transition go wrong in a specific way. The team builds a pilot that works well. They deploy it. Users are happy for two weeks. Then the data grows, the query patterns shift, the retrieval latency increases, and the agent quietly degrades. By the time someone notices, the agent has been producing subtly wrong answers for a week. The trust damage is worse than if the agent had crashed on day one.
This is the gap that harness engineering addresses at the infrastructure level. But even with a well-built harness, you need observability to know when the harness itself is under strain. A harness that enforces validation is great. A harness that enforces validation and tells you when validation pass rates are declining is better.
The pilot-to-production gap is also where context window utilization problems appear. In a pilot, you are testing with representative queries. In production, you get edge cases. Queries that trigger unusual retrieval patterns. Multi-turn conversations where context accumulates faster than expected. Tool calls that return larger-than-anticipated responses.
All of these push the context window toward its limits in ways that did not show up during the pilot. If you are not monitoring utilization, you will not see it happening until the agent starts producing incoherent output on long conversations.
The antidote is simple, though not easy: build the observability infrastructure during the pilot phase, not after the production deployment. Accept that the pilot's job is not just to prove the agent works. The pilot's job is to build the system that will tell you when the agent stops working.
Mean Time to Diagnose as the Key Metric#
If I had to pick one metric to track for agent observability, it would be mean time to diagnose, or MTTD.
Not mean time to detect. Detection is often fast because users notice wrong outputs and report them. The expensive part is diagnosis. It is the time between "we know the agent is producing bad output" and "we know why."
My vector DB timeout story is a MTTD of three days. With proper tracing, it would have been four minutes. Open the trace. See the 5-second retrieval. See the zero results. Done.
MTTD in agent systems is different from traditional MTTD because agent failures are compositional. The wrong output might be caused by a retrieval problem, a context problem, a tool problem, or a model problem. Or a combination. Without traces, you are checking each possibility sequentially, often through reproduction, which means re-running the agent and hoping the failure happens again.
With traces, you go straight to the run that produced the bad output. You walk the trace. You see which steps behaved normally and which did not. You find the root cause. The sequential search becomes a direct lookup.
Teams I have talked to that have invested in agent observability report MTTD reductions from days to minutes. Not hours. Minutes. The reason is that agent failures, once you can see them, are usually obvious. The retrieval was empty. The tool timed out. The context window was full. These are not subtle bugs. They are infrastructure problems that are invisible without instrumentation and obvious with it.
Here is how I think about the return on investment: every hour you spend building agent observability infrastructure saves you five to ten hours of future debugging. That ratio only improves as the agent system gets more complex, because the debugging difficulty scales superlinearly with system complexity while the observability infrastructure scales linearly.
The teams that figure this out now, while agent systems are still relatively simple, will have a compounding advantage over teams that defer it. When your agent goes from five steps to fifty, from one tool to twenty, from a pilot to a production system handling thousands of requests, the observability infrastructure you built early will be the difference between a system you can operate confidently and a system you are afraid to touch.
That fear, the reluctance to change an agent because you do not understand why it works, is the final cost of the observability gap. And it is the one that compounds the most dangerously, because it turns into a system that nobody maintains, nobody improves, and eventually nobody trusts.
The fix is not complicated. It is just unfamiliar. Instrument the agent like the distributed system it is. Trace every step. Measure every latency. Monitor the context window. And when something breaks, look at the trace instead of guessing.
Three days of debugging. One line of code. Do not let that be your story too.
Key takeaway: Every hour spent building agent observability infrastructure saves five to ten hours of future debugging. That ratio improves as agent complexity grows, because debugging difficulty scales superlinearly while observability infrastructure scales linearly.
FAQ#
What is the observability gap in AI agents?#
The observability gap is the lack of tracing, metrics, and monitoring in most AI agent systems running in production. Unlike traditional software where logging and monitoring are standard practices, most agent systems have no visibility into what happens between the user's input and the agent's output. This means failures are detected by noticing wrong outputs rather than by automated monitoring, and diagnosing the root cause can take days instead of minutes.
Why do AI agents need distributed tracing?#
AI agents make multiple sequential and sometimes parallel calls during a single run. They query databases, invoke tools, make LLM inference calls, and execute branching logic. Each step can fail independently and affect downstream steps. Without distributed tracing, you cannot determine which step in the sequence caused a bad output. Tracing gives you a hierarchical view of every action the agent took, with timing and input/output data for each step.
What are the most common silent failure patterns in AI agents?#
The most dangerous silent failures include empty retrievals (where a vector database returns zero results instead of an error), partial tool responses (where a tool returns incomplete data with a success status), context window overflow (where the agent loses access to earlier information as the window fills up), stale cache hits (where cached data no longer reflects the current state), and hallucinated tool calls (where the agent attempts to call tools that do not exist or uses invalid parameters). All of these share the trait that the agent continues to produce output, making the failure invisible without instrumentation.
How do I choose between Langfuse, Arize, Braintrust, and LangSmith?#
The choice depends on your existing infrastructure and primary need. Langfuse is the best starting point for teams that want comprehensive tracing and are comfortable self-hosting. LangSmith is the easiest option for teams already using LangChain. Braintrust is strongest for development-time evaluation and quality measurement. Arize Phoenix is best for teams that already have basic tracing and need drift detection and evaluation over time. For teams with mature OpenTelemetry infrastructure, custom spans may be the most practical approach because they integrate with existing monitoring tools.
What should I trace in an AI agent system?#
At minimum, trace every tool call, every retrieval operation, every LLM generation, and every branching decision. For each traced step, capture the input, output, duration, and context window utilization at that point. Add semantic checks that flag anomalies like empty retrievals or unusually large context consumption. Over time, add attributes specific to your domain, such as retrieval result counts, cache hit rates, and token costs per step.
What is the most important observability metric for AI agents?#
Mean time to diagnose is the single most impactful metric. Detection is usually fast because users report bad outputs. The expensive part is figuring out why the agent produced the wrong answer. With proper tracing, diagnosis drops from days to minutes because you can walk the trace for the specific run that failed and identify the root cause directly instead of searching sequentially through possible failure modes.
Can I add observability to an existing agent system or do I need to rebuild?#
You can add observability incrementally to an existing system. Start by wrapping each step of your agent in a trace span that records inputs, outputs, and timing. This can be done with a decorator or middleware pattern that does not require restructuring the agent's core logic. Then add semantic checks. Then build a dashboard. The most important step is the first one: getting traces for every run. Everything else builds on top of that data.