I have sat in enough post-mortems to know how this goes. Something breaks in production. The team pulls up the logs. Logs look fine. HTTP 200s everywhere. Latency within normal range. And yet the agent did something wrong, something it should never have done, and a customer noticed before we did.
The problem is not that monitoring failed. The problem is that what most teams call "tracing" is not tracing at all. It is logging with a nicer dashboard.
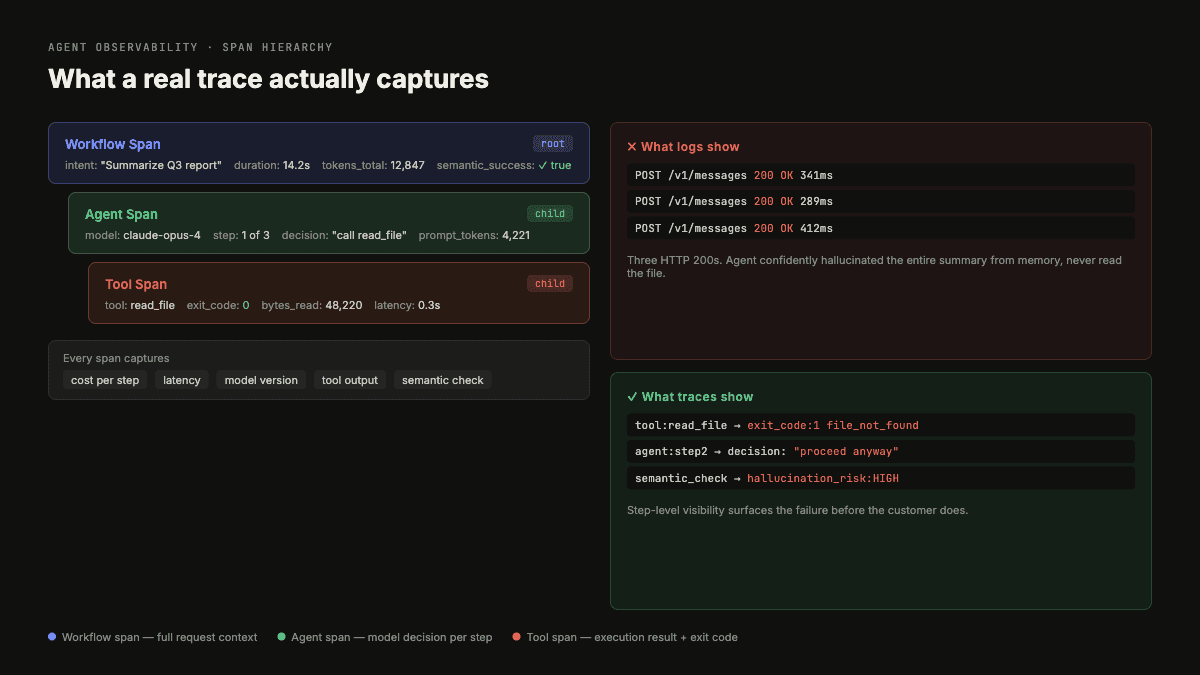
Table of Contents#
- Logs and Traces Are Not the Same Thing
- The Span Hierarchy That Actually Matters
- The Semantic Success Problem
- What Each Span Should Actually Carry
- MCP Closes the Last Black Box
- What to Do Next
- How I Would Run This in Production
- What I Would Measure
- Where This Connects
- FAQ
Logs and Traces Are Not the Same Thing#
This is the part nobody wants to say out loud: only 62% of production teams have step-level tracing for their agent systems. The other 38% are flying with instruments that tell them whether the plane is in the air, not whether it is going to the right airport.
Logs tell you what happened. A trace tells you why, in what order, under what conditions, and at what cost. For a simple CRUD API, logs are often enough. For an agent system that reasons across multiple steps, calls external tools, and makes branching decisions based on intermediate outputs, logs will actively mislead you.
Here is what a log gives you: "Tool called. Tool returned. Request completed."
Here is what a span gives you: the agent ID, the operation type, the model and provider, the tool name and every argument passed to it, the token counts in and out, the total cost, the latency at that exact step, the intermediate reasoning trace showing what the agent was thinking when it decided to call that tool, the evaluation result, the retry count, and whether this was a loop iteration or a fresh invocation.
That is not the same instrument.
The Span Hierarchy That Actually Matters#
The OpenTelemetry GenAI semantic conventions (v1.41) define four span types for agent systems:
invoke_workflow: INTERNAL span, the parent. This wraps the entire execution.invoke_agent(local): INTERNAL span. This is your in-process agent reasoning step.invoke_agent(remote): CLIENT span. Used when you are calling OpenAI Assistants or Amazon Bedrock, where the agent execution happens outside your process.execute_tool: INTERNAL span. Every tool call gets its own span.
The hierarchy looks like this: invoke_workflow to invoke_agent to execute_tool. That nesting is not cosmetic. It is what lets you answer questions like "how many times did the agent loop before deciding to call this tool?" and "what was the cumulative token cost across all steps before we hit the first tool error?"
A flat log cannot answer those questions. The nesting is the information.
Here is what the setup looks like in practice:
from opentelemetry import trace
from opentelemetry.sdk.trace import TracerProvider
from opentelemetry.semconv._incubating.attributes import gen_ai_attributes

tracer = trace.get_tracer("my.agent", "1.0.0")

def run_workflow(workflow_id: str, input: str):
    with tracer.start_as_current_span(
        "invoke_workflow",
        kind=trace.SpanKind.INTERNAL,
        attributes={
            "gen_ai.operation.name": "invoke_workflow",
            "gen_ai.agent.id": workflow_id,
            "gen_ai.system": "openai",
        }
    ) as workflow_span:
        result = run_agent_step(input, workflow_span)
        workflow_span.set_attribute("gen_ai.usage.output_tokens", result.total_tokens)
        return result

def run_agent_step(input: str, parent_span):
    with tracer.start_as_current_span(
        "invoke_agent",
        kind=trace.SpanKind.INTERNAL,
        attributes={
            "gen_ai.operation.name": "invoke_agent",
            "gen_ai.agent.id": "reasoning-agent-v2",
            "gen_ai.request.model": "gpt-4o",
            "gen_ai.agent.loop_depth": 0,
        }
    ) as agent_span:
        # reasoning trace captured here as span events
        agent_span.add_event("agent.reasoning", {
            "gen_ai.agent.reasoning_trace": "User asked X. I need tool Y to get Z."
        })
        return call_tool("search", {"query": input}, agent_span)

def call_tool(tool_name: str, args: dict, parent_span):
    with tracer.start_as_current_span(
        "execute_tool",
        kind=trace.SpanKind.INTERNAL,
        attributes={
            "gen_ai.tool.name": tool_name,
            # sanitize args before attaching, strip PII first
            "gen_ai.tool.call.arguments": sanitize(args),
        }
    ) as tool_span:
        result = tools[tool_name](**args)
        tool_span.set_attribute("gen_ai.tool.result", result.summary)
        return result
One practical note: set OTEL_SEMCONV_STABILITY_OPT_IN=gen_ai_latest_experimental in your environment. This enables dual-emit mode, which lets you emit under both old and new attribute names simultaneously. When the spec changes (and it will), you will not have to re-instrument everything at once.
The Semantic Success Problem#
Here is the thing that keeps me up at night about agent monitoring.
Traditional application monitoring has a clear success signal: did the code execute without throwing an error? For agents, that is necessary but nowhere near sufficient. An agent can return HTTP 200, use syntactically valid tool arguments, and still have done the completely wrong thing.
I think about tool calls in three layers:
Syntactic success: The tool was called with valid parameters. The API accepted the request.
Semantic success: The tool call was the right action to take given the agent's goal.
Necessity: The tool call was even needed. Maybe the agent had enough information already and calling the tool was redundant, or worse, a sign of reasoning drift.
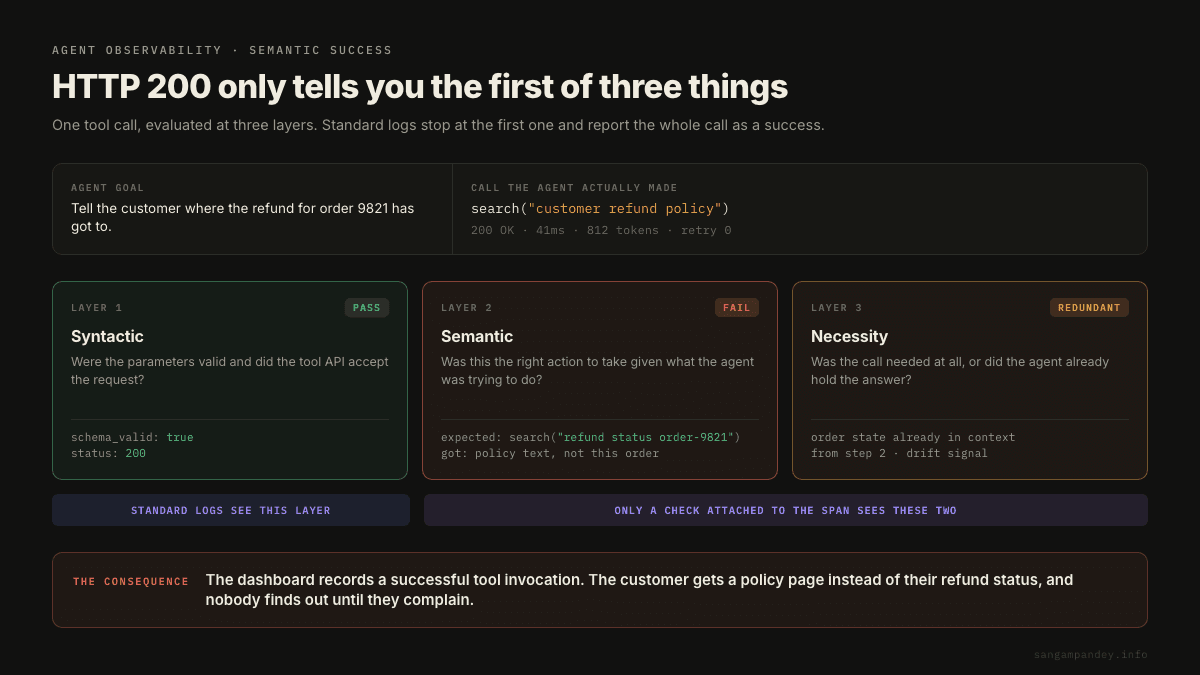
Standard logs catch syntactic failures. A 400 from the tool API shows up. But if the agent called search("customer refund policy") when it should have called search("customer refund status order-9821"), the logs will show a successful tool invocation. The downstream behavior will be wrong. And you will not know until someone complains.
This is why evaluation results need to be attached to spans at the time of execution, not retroactively in a separate pipeline. When you run an LLM-as-judge or a deterministic check on an intermediate reasoning step, that result belongs on the span for that step. Otherwise you are correlating evaluation signals to execution in a spreadsheet after the fact, which is slow and unreliable.
What Each Span Should Actually Carry#
I will be direct about what I consider the minimum viable span for a production agent:
- Agent ID and operation type
- Model name and provider
- Tool name and arguments (with PII sanitization applied before attaching)
- Input and output token counts, plus computed total cost
- Latency at this span level, not just end-to-end
- The reasoning trace, specifically the intermediate thoughts at each ReAct step
- Evaluation result, attached inline
- Error type and what recovery action was taken
- Retry count and current loop depth
- Kubernetes pod and node metadata so you can correlate agent behavior to infrastructure events
That last one matters more than people think. An agent that starts behaving oddly on a specific subset of requests might be running on a node with memory pressure. You'll never see that connection without infrastructure metadata on the span.
MCP Closes the Last Black Box#
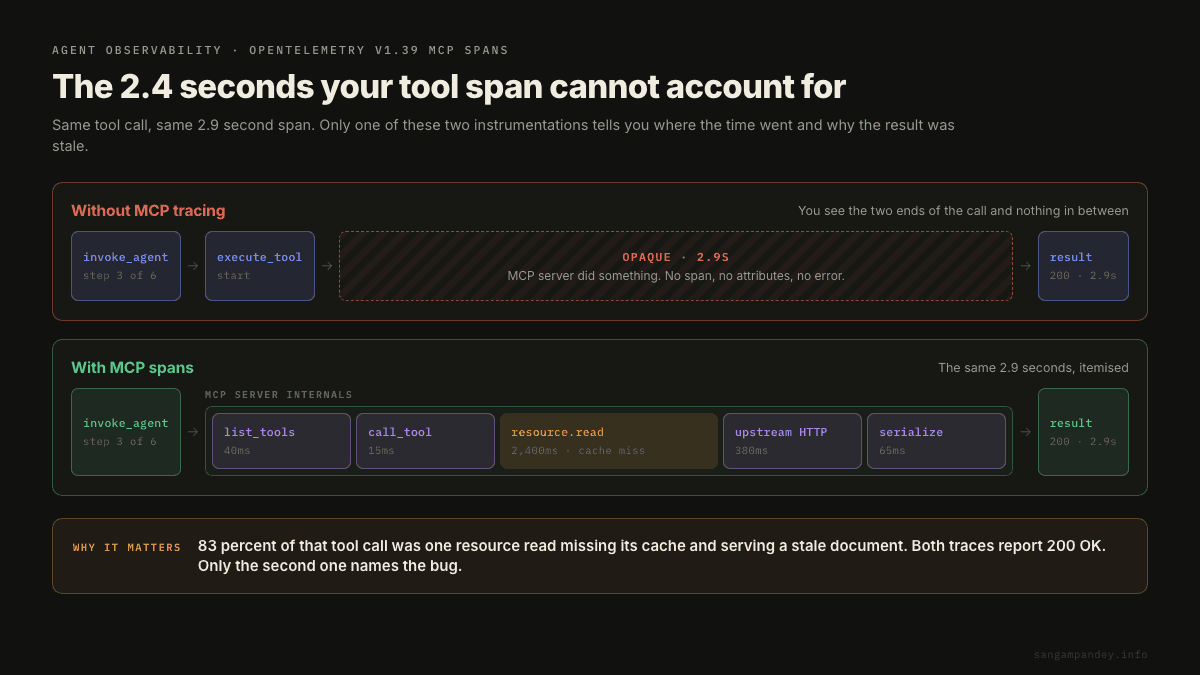
If you are running tools through MCP (Model Context Protocol), you have a black box inside your black box. OTel v1.39 added MCP-specific tracing, and it is the only way to see what actually happens at the tool layer when MCP is in the middle.
Without MCP tracing, you can see that execute_tool was called and what came back. You cannot see what the MCP server did between those two events. For debugging subtle failures, that gap is often exactly where the problem lives.
What to Do Next#
This is not a "raise awareness" post. Here are the four things I would actually do, in order:
1. Audit your current coverage. If you do not have span-level tracing with the invoke_workflow to invoke_agent to execute_tool hierarchy in place today, that is your first gap. Check whether your teams even have step-level tracing at all. You might be in the 38%.
2. Instrument tool calls with semantic evaluation. Pick your three most consequential tools. For each one, add a check after execution that asks whether the call was not just syntactically valid but actually the right action. Attach that result to the span. Run this for a week and see what you find.
3. Set OTEL_SEMCONV_STABILITY_OPT_IN=gen_ai_latest_experimental now. This takes five minutes and saves you from a painful re-instrumentation when the GenAI semconv spec stabilizes.
4. Add Kubernetes metadata to your spans. Infrastructure correlation is underrated. If you are running agents at any real scale, you will eventually hit a failure mode that only shows up on specific infrastructure. Without pod and node metadata on your spans, you are debugging blind.
The traces you have right now are probably telling you your agents are healthy. They might be right. But they might be showing you a clean HTTP 200 while your agent is confidently doing the wrong thing, one semantically invalid tool call at a time.
This is part of an ongoing series on AI agent lifecycle: from instrumentation to evaluation to production operations. Next up: evaluation harnesses that catch the failures traces surface.
How I Would Run This in Production#
I would start with the three most common production paths, not the most interesting ones. Pick the agent run that drives the most revenue, the one that handles the most sensitive data, and the one that fails most often. Those three flows usually teach you more than a generic tracing rollout across every endpoint.
For each flow, draw the span tree on paper before touching code. The root should be the workflow. Every reasoning step should be an agent span. Every external action should be a tool span. If a human reviewer would ask why the agent made a decision, the evidence for that decision belongs on the nearest span, not in a separate log stream.
The uncomfortable part is sanitization. Teams either attach nothing because they are afraid of leaking data, or they attach raw prompts and tool payloads because debugging is easier. Both are weak defaults. I prefer a small sanitizer that redacts PII, stores stable hashes for correlation, and preserves the fields needed to understand intent.
Once the tree exists, attach one semantic check to one consequential tool. Do not start with a huge judge suite. Start with a yes or no question: was this tool call necessary and aimed at the right object? That one signal changes how debugging feels because a green trace can now still contain a failed decision.
What I Would Measure#
The metrics I would watch are trace coverage, span completeness, semantic failure rate, tool retry rate, cost per successful workflow, and time to isolate root cause. Trace coverage tells you whether the system is visible. Span completeness tells you whether the visible data is useful.
Semantic failure rate is the important one. A tool can return 200 and still be the wrong tool. When that happens, your incident is not an availability problem. It is a decision quality problem. Tracking those failures on spans gives product, engineering, and support a shared object to inspect.
Cost per successful workflow should be measured after failed and retried steps, not just on the final model call. Agent systems often look cheap at the request level and expensive at the workflow level. Traces are where that difference becomes obvious.
Where This Connects#
This post is one piece of the production agent lifecycle. The adjacent pieces matter because the failure usually does not stay inside one layer. A tracing problem becomes an eval problem. An eval problem becomes an ownership problem. A routing problem becomes a cost and security problem if nobody can see what changed.
- Offline Evals as a CI Gate
- Why You Need Offline and Online Evals
- Three Days Debugging a One-Line Fix: Why AI Agents Need Tracing
- The 10x Cost Difference Nobody Talks About
- Who Actually Owns Eval Quality
If you are using this as a checklist, read those posts as dependencies rather than as optional background. The stack only becomes reliable when the evidence loop, the release loop, and the security loop all point at the same production behavior.
FAQ#
What is the difference between logs and traces for AI agents?#
Logs show events as isolated messages. Traces show the full execution path, including nested agent reasoning steps, tool calls, retries, token usage, latency, and semantic checks. For agents, the ordering and parent-child relationship between steps is often the actual debugging signal.
Should every tool argument be stored on a span?#
No. Store the fields needed for debugging after sanitization. Raw PII, secrets, full documents, and unbounded prompt payloads should not be attached directly. Use redaction, stable hashes, and summarized payloads so the trace remains useful without becoming a data leak.
Where should LLM-as-judge results live?#
Attach judge results to the span that produced the behavior being judged. If the judge evaluates a tool decision, the result belongs on that tool span or the immediately preceding agent span. Keeping it in a separate dashboard makes correlation slower and more error-prone.
Do I need OpenTelemetry for this?#
You do not strictly need it, but OpenTelemetry gives you a shared vocabulary, vendor portability, and support for GenAI semantic conventions. That matters once your agent stack crosses model providers, application services, MCP servers, and infrastructure.
What is the smallest useful rollout?#
Instrument one workflow with the workflow-agent-tool hierarchy, attach token and cost attributes, add sanitized tool arguments, and run one semantic check on a high-impact tool. That is enough to reveal whether your current observability is helping or only creating noise.
How often should trace schemas change?#
Rarely. Treat trace attributes like an API. Add fields when you need new debugging capability, but avoid changing names casually because dashboards, alerts, and eval pipelines will depend on them.
Implementation Review Checklist#
Before I would call this production-ready, I would ask five questions in the review. First, does the team know which artifact changed because of this lesson? A trace field, eval case, prompt file, routing rule, dashboard, or security policy should be visible in the repo or the runbook. If the only output is agreement, the lesson has not landed yet.
Second, can the team reproduce the failure mode in a lower environment? Production AI work gets messy when the only evidence is a screenshot, a Slack thread, or a vague user complaint. A reproducible example gives the team something concrete to test against after the fix.
Third, does the fix have an owner after the first merge? Most agent systems decay slowly. Datasets go stale, prompts drift, routing rules stop matching traffic, and permissions expand. The owner is the person who notices that drift before it becomes an incident.
Fourth, is rollback obvious? If a prompt, model, parser, evaluator, or security rule makes behavior worse, the team should know how to return to the last known-good version without rewriting the system under pressure.
Fifth, did the incident or improvement strengthen the loop? A good production process compounds. The trace becomes an eval. The eval becomes a gate. The gate becomes a safer release. That is the practical standard I would use for every idea in this series.
I would also ask whether the change makes the system easier to explain to a new teammate. Production AI stacks fail when the important behavior lives in someone s memory. If the reason for a prompt rule, routing threshold, eval example, or tool permission is not written down, the next person will eventually delete it while cleaning up what looks like accidental complexity.
The review should include one negative example. Show the input that used to fail, the trace or eval result that made the failure visible, and the current behavior after the change. This keeps the team grounded in evidence. It also stops the review from becoming abstract, which is where AI engineering discussions often drift.
For agent systems, I would check the cost impact and the quality impact together. A fix that improves quality by calling a frontier model three extra times may be correct for a regulated workflow and wrong for a low-margin support workflow. A cost reduction that removes useful context may look good for a week and then show up as worse user outcomes. The trade-off has to be explicit.
The last check is operational ownership. If the change creates a new dashboard, who looks at it? If it creates a new eval, who updates it? If it creates a new permission boundary, who approves exceptions? The difference between a strong production practice and a temporary cleanup is usually whether the maintenance path is obvious.
None of this needs to be heavy. A short pull request note, one linked trace, one eval case, and one owner are enough for many changes. The point is to leave a trail that future engineering work can build on. That is how AI systems become more reliable over time instead of slowly collecting unexplained rules.